Paull, John and Hennig, Benjamin (2018) Maps of Organic Agriculture in Australia. Journal of Organics, 5 (1), pp. 29-39.
|
PDF
- Published Version
- English
Available under License Creative Commons Attribution. 6MB | |
![[thumbnail of PaullHennig.2018.OrganicHectaresMapAust.jpg]](/34291/3.hassmallThumbnailVersion/PaullHennig.2018.OrganicHectaresMapAust.jpg)  Preview |
Image (JPEG)
- Published Version
- English
Available under License Creative Commons Attribution. 910kB |
![[thumbnail of PaullHennig2018.OrganicProducersAust.jpg]](/34291/8.hassmallThumbnailVersion/PaullHennig2018.OrganicProducersAust.jpg)  Preview |
Image (JPEG)
- Published Version
- English
Available under License Creative Commons Attribution. 960kB |
![[thumbnail of PaullHennig.2018.OrganicOperatorsAust.jpg]](/34291/18.hassmallThumbnailVersion/PaullHennig.2018.OrganicOperatorsAust.jpg)  Preview |
Image (JPEG)
- Published Version
- English
Available under License Creative Commons Attribution. 1MB |
Document available online at: http://www.academia.edu/37851248/Maps_of_Organic_Agriculture_in_Australia
Summary in the original language of the document
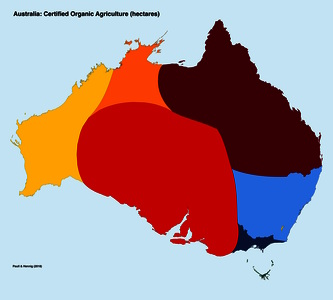
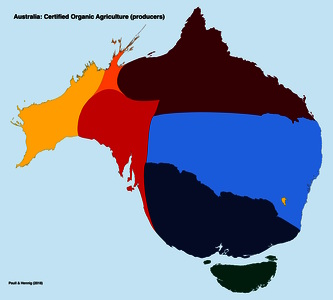
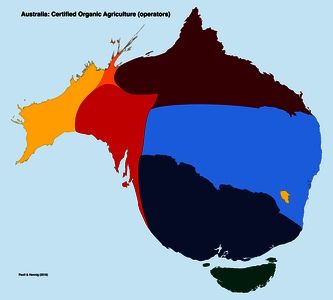
Australia is the world leader in organic agriculture, based on certified organic hectares. This has been the case since global organic statistics were first published (in 2000). Australia now accounts for more than half of the world’s certified organic hectares (54%). Australia has 35,645,000 certified organic hectares which is 8.8% of Australia’s agricultural land. In the present paper, three maps (cartograms, ‘maps with attitude’) of organic agriculture in Australia are presented. These three maps illustrate the data, at the state and territory level, for (a) certified organic hectares (35,645,037 hectares) (b) certified organic producers (n = 1,998), and (c) certified organic operators (producers + handlers + processors) (n = 4,028). States and territories are resized according to their measure for each attribute. The base-map for Australia, with states and territories coloured according to their state colours (or a variation thereof), is the standard cartographic representation of the country. The three organics maps are density-equalising cartograms (area cartograms) where equal areas on the map represent equal measures (densities) of the parameter under consideration. This mapping protocol creates distorted yet recognisable new maps that reveal where there is a high presence of the parameter under consideration (and the state or territory is ‘fat’), or a low presence (and the state or territory is ‘skinny’). These three maps visually reveal the uneven distribution of the metrics of organics across Australia, and, on a state by state basis, they suggest unrealised opportunities and potentials.
Repository Staff Only: item control page

 Download Statistics
 Download Statistics
